Sunday Spectacle CCXXIX
Central Bank Money Printing
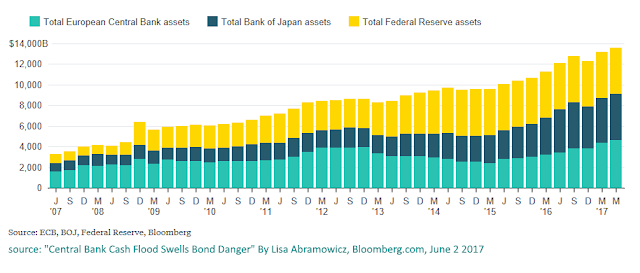
Central banks generally increase assets by printing money and buying them, so the charts below are indicative of their money printing. Historically, increase in central bank balance sheet (i.e. increase in money printing and supply of money) has led to inflation in goods and services (this is offset by deflation or wealth destruction and a bunch of other factors). Recently most of the money printing has been used to buy financial assets--for instance, the JCB is a big owner of Japanese stocks--so it is not clear to me if the situation will be similar to the inflationary busts we have seen in the past. Beyond inflation, too much central bank asset purchases also distorts the market and crowds out the private sector--not a good thing from a capitalist point of view (private sector makes better capital allocation decisions than the government).
It's interesting how the main 3 developed country central banks have behaved over the last decade.
source: "Central Bank Cash Flood Swells Bond Danger" by Lisa Abramowicz, Bloomberg.com, June 2 2017
Not visible in the chart below but looking at the interactive chart in the Bloomberg article, we see...
(figures are rounded to nearest 0.1 trillion)
- In June 2007, ECB assets were $1.6 trillion, JCB was $0.8 trillion and FedRes was $0.9 trillion.
- As of March 2012, ECB had ramped up its assets to $4.0 trillion, while FedRes was at $2.9 trillion and JCB was $1.7 trillion.
- By September 2014, FedRes assets had gone up significantly to $4.5 trillion, while ECB was $2.6 trillion and JCB was $2.5 trillion.
- Interestingly, jumping to the present (May 2017), FedRes has not increased its asset base which is still around $4.5 trillion, while ECB has gone up to $4.7 trillion and JCB to $4.5 trillion.
The things that stand out to me are:
- FedRes balance sheet was clean and had low "economic leverage" before the financial crisis. Relative to the size of the economy, FedRes has less assets than in Europe or Japan (do note that I'm being very simplistic here and there are many other things and operations undertaken by central banks which are unique to that region and won't be properly captured in these asset figures). Some people find the FedRes balance sheet alarming (because they look at how it was a decade or two ago) but it actually is the better one of the three above. If I'm not mistaken, the US Federal Reserve has also not intervened directly in the stock market and purchased stocks en masse like the JCB or Swiss Central Bank (not shown above)--this is a good thing for US corporations and the US economy (the less central bank involvement, the better IMO).
- Once the FedRes hit around $4.5 trillion in 2014, it has stayed the same. In contrast, JCB has significantly ramped up its assets.
- The ECB seems to tweak its assets more so than others. For instance, its assets were $4 trillion in 2012 but then dropped to $2.6T in 2014 and is now back up to $4.7T in 2017. I'm not sure if this is due to economic events (such as Greek crisis a few years ago) or for some political reason or something else. I also haven't looked to see if the changes are due to currency fluctuations (for example, Euro has declined against the US$ recently).
- JCB assets seem really high compared to the size of the economy. Japan has always been a mystery and it's not really clear how it is going to play out.


Comments
Post a Comment